In the fast-paced world of project management, effective visualization tools are essential for success. Among the myriad options available, the Gantt chart stands out as a timeless and powerful tool. In this comprehensive guide, we delve into the intricacies of Gantt charts, exploring their definition, applications, components, as well as the pros and cons of incorporating them into project management workflows. Finally, we’ll conclude with a look at how innovative solutions like Stintar are revolutionizing project management processes.
What is a Gantt Chart?
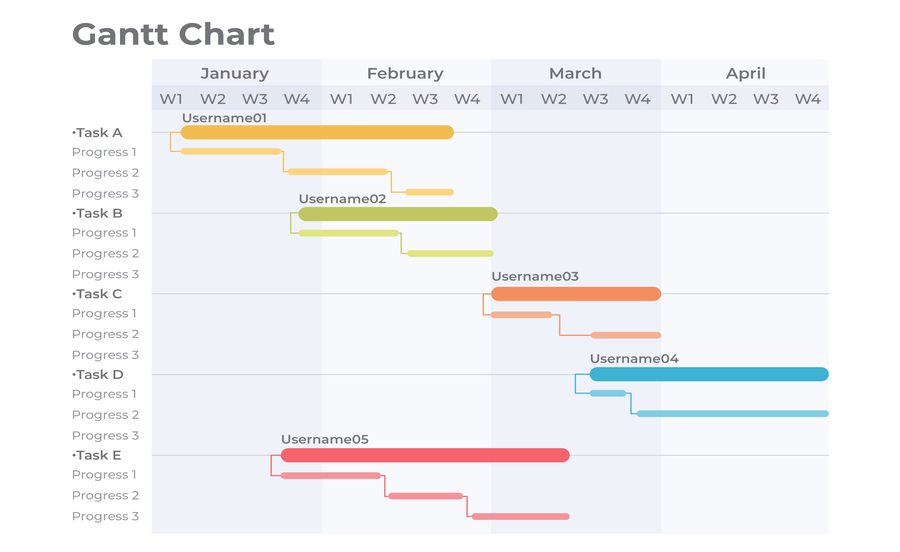
A Gantt chart is a visual representation of a project’s schedule, tasks, and progress over time. Named after Henry Gantt, who pioneered its usage in the early 20th century, this tool has become synonymous with project planning and management. At its core, a Gantt chart comprises horizontal bars that correspond to project tasks, laid out against a timeline spanning from project initiation to completion.
What is it Used For?
Gantt charts serve a multitude of purposes in project management, making them indispensable to teams across industries. Here are some key applications:
- Project Scheduling: Gantt charts provide a clear overview of task timelines, enabling project managers to allocate resources efficiently and ensure timely completion.
- Task Tracking: By visually representing tasks and their dependencies, Gantt charts facilitate real-time monitoring of project progress, allowing teams to identify bottlenecks and adjust timelines accordingly.
- Communication: Gantt charts serve as a visual communication tool, enabling stakeholders to grasp project status and milestones at a glance, fostering transparency and alignment.
- Resource Management: With the ability to visualize task dependencies and resource allocation, Gantt charts aid in optimizing resource utilization, preventing overallocation or conflicts.
Components of a Gantt Chart
Understanding the key components of a Gantt chart is essential for harnessing its full potential. Here’s an overview:
- Dates/Times: The horizontal axis of the chart represents time, typically divided into days, weeks, or months, depending on the project duration.
- Tasks and Task Bars: Each task is depicted as a horizontal bar, with its length corresponding to its duration. Tasks are arranged vertically, often in hierarchical order.
- Milestones: Significant project milestones, such as project kickoff, deliverables, or client meetings, are marked on the chart to denote key achievements or deadlines.
- Dependencies: Arrows or lines between task bars indicate task dependencies, illustrating the sequence in which tasks must be completed.
- Progress Tracking: Progress is indicated either by shading or by a distinct marker within each task bar, providing a visual representation of completed, ongoing, and pending tasks.
- Resource Allocation: Some Gantt charts include resource assignments, indicating which team members or resources are responsible for each task.
The Pros and Cons of Using a Gantt Chart in Project Management
Pros:
- Clarity and Visualization: Gantt charts offer a visually intuitive way to understand project timelines, tasks, and dependencies, promoting clarity and alignment among team members.
- Efficient Resource Allocation: By visualizing resource availability and task dependencies, Gantt charts help project managers allocate resources effectively, minimizing conflicts and bottlenecks.
- Real-time Monitoring: Teams can track project progress in real-time, identify potential delays or issues, and make timely adjustments to ensure project success.
- Communication and Transparency: Gantt charts serve as a communication tool, enabling stakeholders to stay informed about project status, milestones, and deadlines, fostering transparency and collaboration.
Cons:
- Complexity: Gantt charts can become complex and overwhelming, especially for large or intricate projects, making them challenging to manage and interpret.
- Maintenance Overhead: Keeping Gantt charts up-to-date requires continuous effort, particularly in dynamic project environments where tasks and timelines frequently change.
- Learning Curve: Team members unfamiliar with Gantt charts may require training to understand and utilize them effectively, potentially slowing down project progress.
- Incomplete Information: Inadequate task descriptions or resource specifications in Gantt charts may lead to misunderstandings or delays in task execution.
Conclusion with Stintar
In conclusion, Gantt charts remain a cornerstone of modern project management, offering unparalleled insights into project timelines, tasks, and dependencies. However, to fully leverage their benefits while mitigating potential drawbacks, teams can turn to innovative solutions like Stintar. Stintar provides advanced project management features, including automated updates, integrated communication tools, and customizable Gantt chart templates, streamlining project workflows and enhancing collaboration. With Stintar, teams can unlock the full potential of Gantt charts and take their project management processes to new heights. Visit Stintar to learn more and revolutionize your project management approach today.